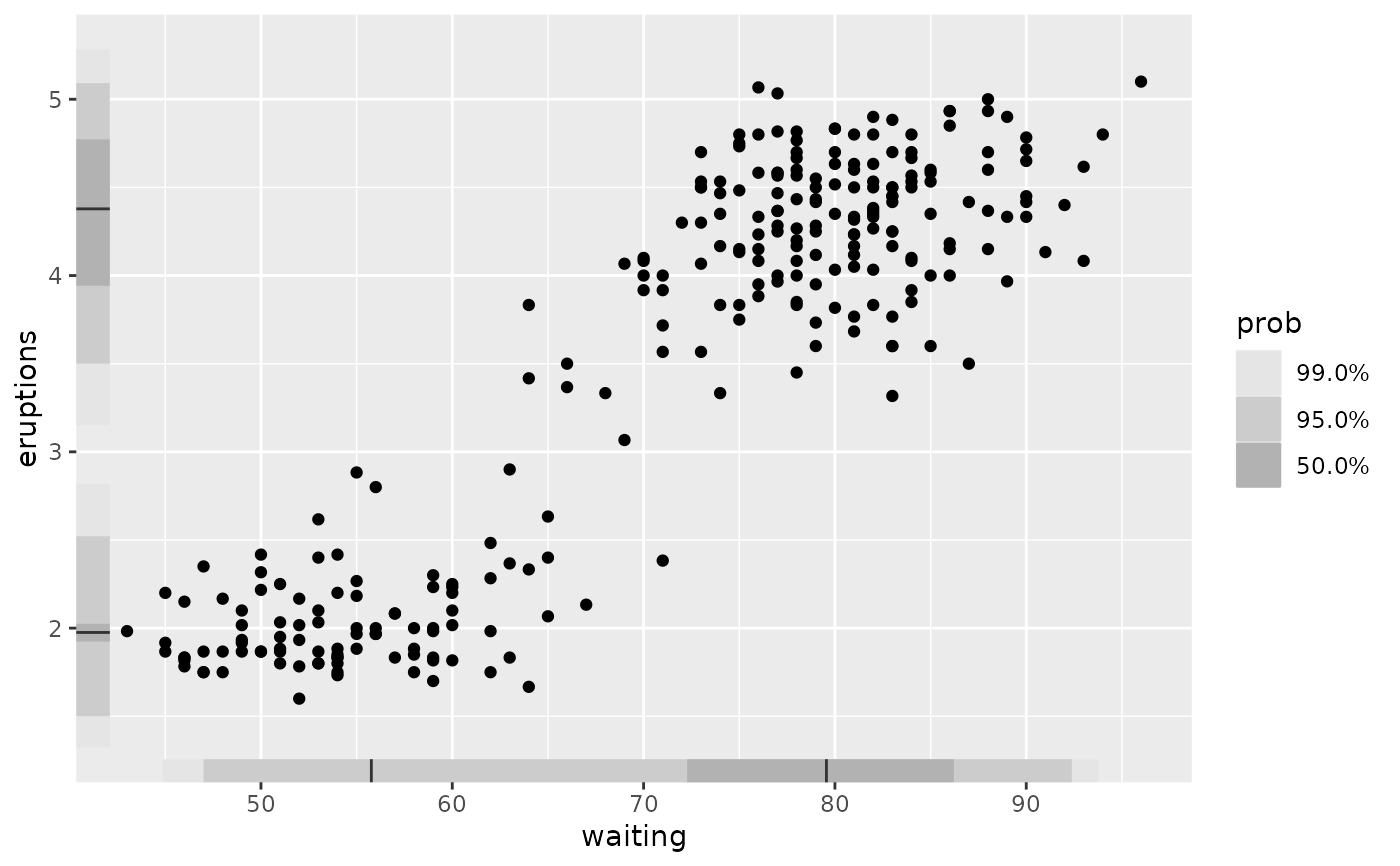
rug visualization for HDR plot
Arguments
- mapping
Default: NULL
- data
data
- stat
stat
- position
Default: "identity"
- ...
...
- na.rm
Default: FALSE
- show.legend
Default: NA
- inherit.aes
Default: TRUE
- sides
position to put rugs
- rug_width
width of rugs, Default: unit(0.03, "npc")
- prob
PARAM_DESCRIPTION, Default: c(0.5, 0.95, 0.99)
Value
Calculates and plots the rug plot of highest density regions.
Examples
library(ggplot2)

ggplot(faithful, aes(x = waiting, y = eruptions)) +
  geom_point() +
  geom_hdr_rug()
